The trace timeline shows where a single request (a trace) spends its time as it moves through many spans. Spans are stacked into a parent–child tree, and each span's start offset and duration are drawn as a horizontal bar — so bottlenecks, ordering, and nesting are readable at a glance.
Flow: Timeline preview → fullscreen
The timeline comes in two stages: a Timeline preview that shows it in context, and a fullscreen overlay for investigation.
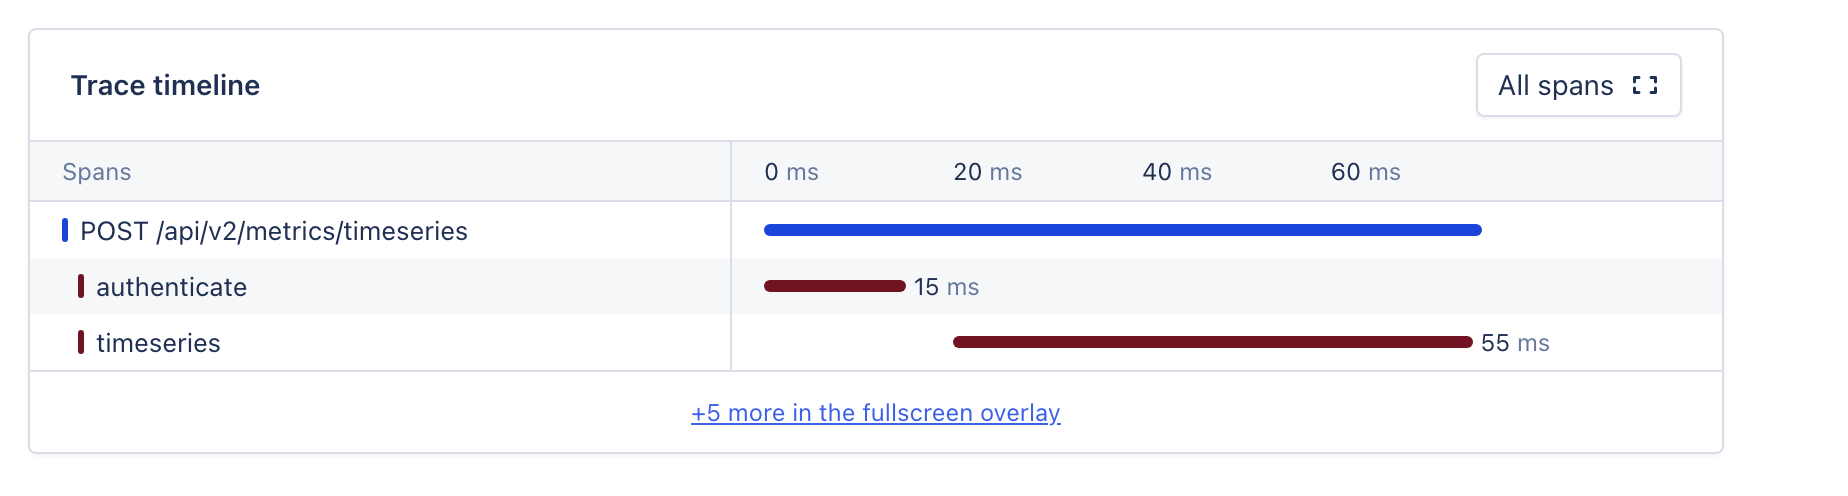
Timeline preview: shows the first 10 spans of the trace and hands the rest to the overlay via +N more.
|
|
Timeline preview TraceTimelineBox |
Fullscreen overlay TraceTimelineOverlay |
|---|---|---|
|
Purpose |
Summary · preview |
Explore · filter · investigate |
|
Spans shown |
First 10 spans of the trace |
All spans (full tree) |
|
Filters |
None |
Service / duration / search / breakdown |
|
Sidebar |
None |
Attributes sidebar |
|
Row height |
28px |
40px (name + namespace, 2 lines) |
|
Entry |
Embedded in other views |
Preview button · span click |
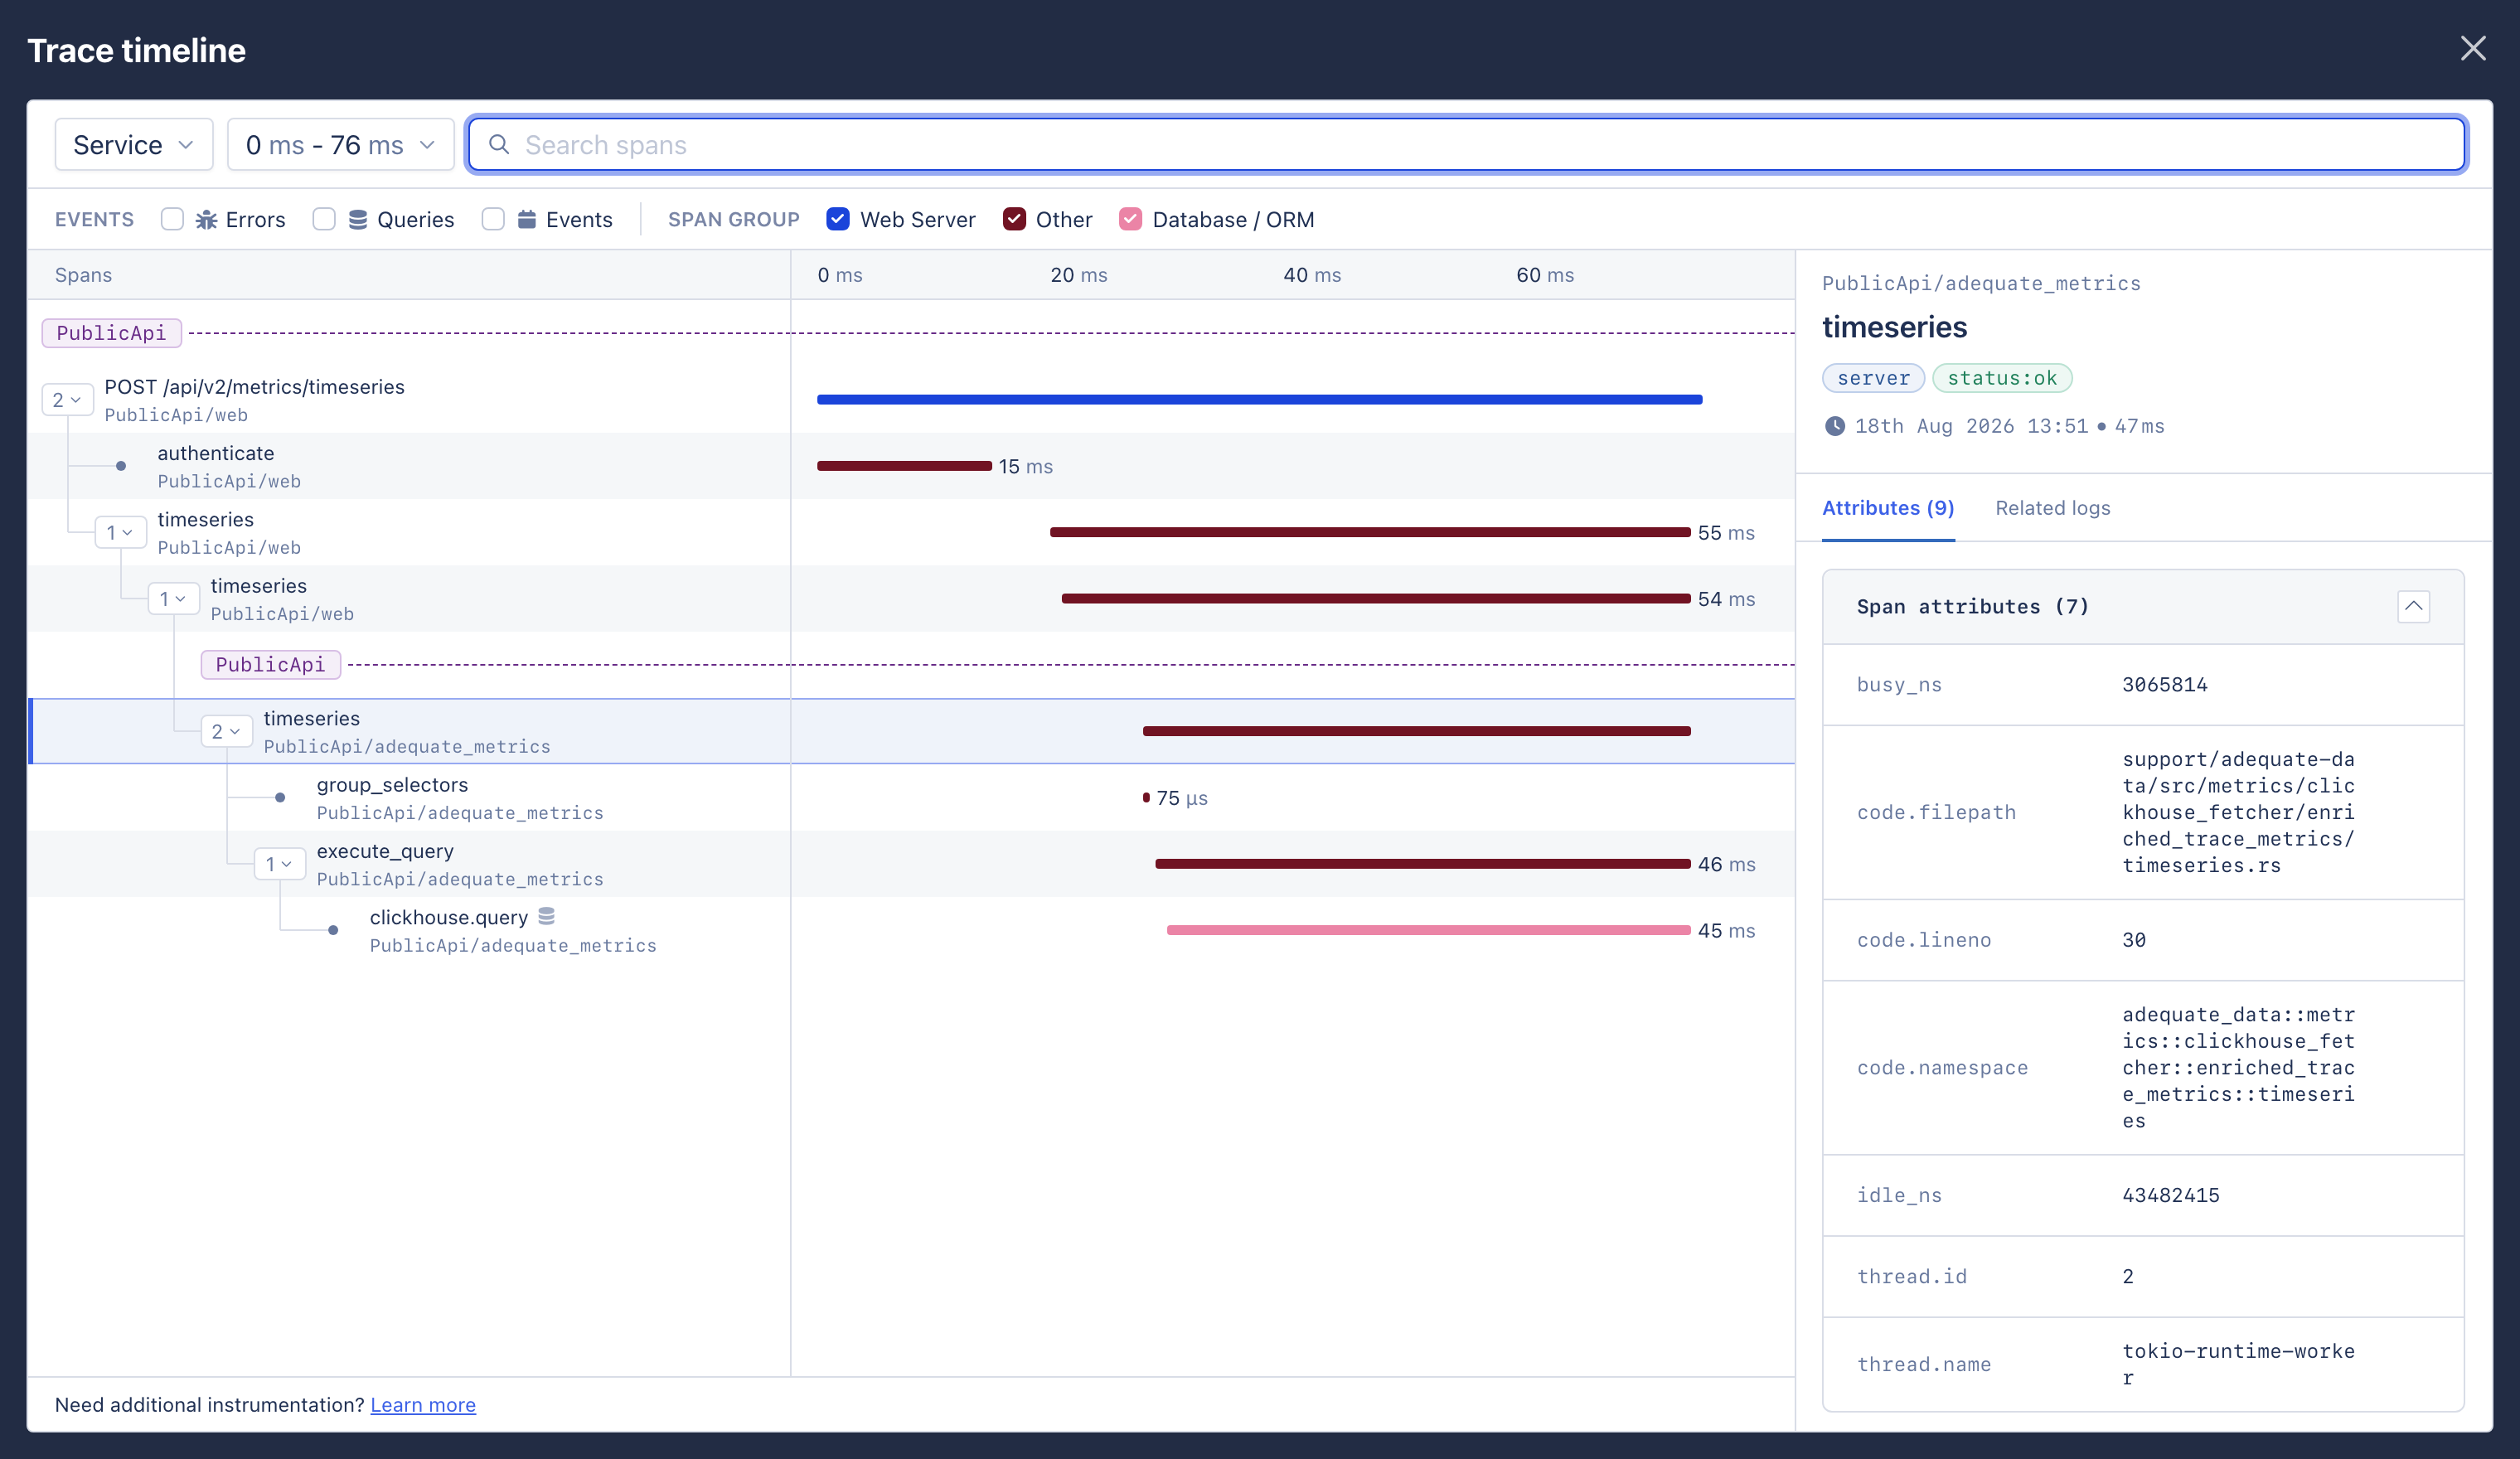
Overlay layout
The fullscreen overlay follows a fixed top-to-bottom order that mirrors the flow “choose what to look at → narrow it down → look → look closer”.
- Title : “Trace timeline”.
- Toolbar : service · duration · search. Narrows the result set itself.
- Filter bar : event toggles + span-group legend that doubles as a filter.
- Body : timeline table on the left (resizable) + attributes sidebar on the right (resizable).
- Footer : instrumentation link. A persistent onboarding hint for users who are short on spans.
Both vertical panels (spans column, sidebar) are resizable, and their widths persist across sessions in localStorage.
|
Panel |
Min |
Default |
Max |
Storage key |
|---|---|---|---|---|
|
Spans column |
240 |
460 |
720 |
trace-timeline-spans-column-width |
|
Attributes sidebar |
320 |
420 |
800 |
trace-timeline-attributes-sidebar-width |
Span row
One row is one span. The left half is identity (tree position + name); the right half is timing (bar + duration).
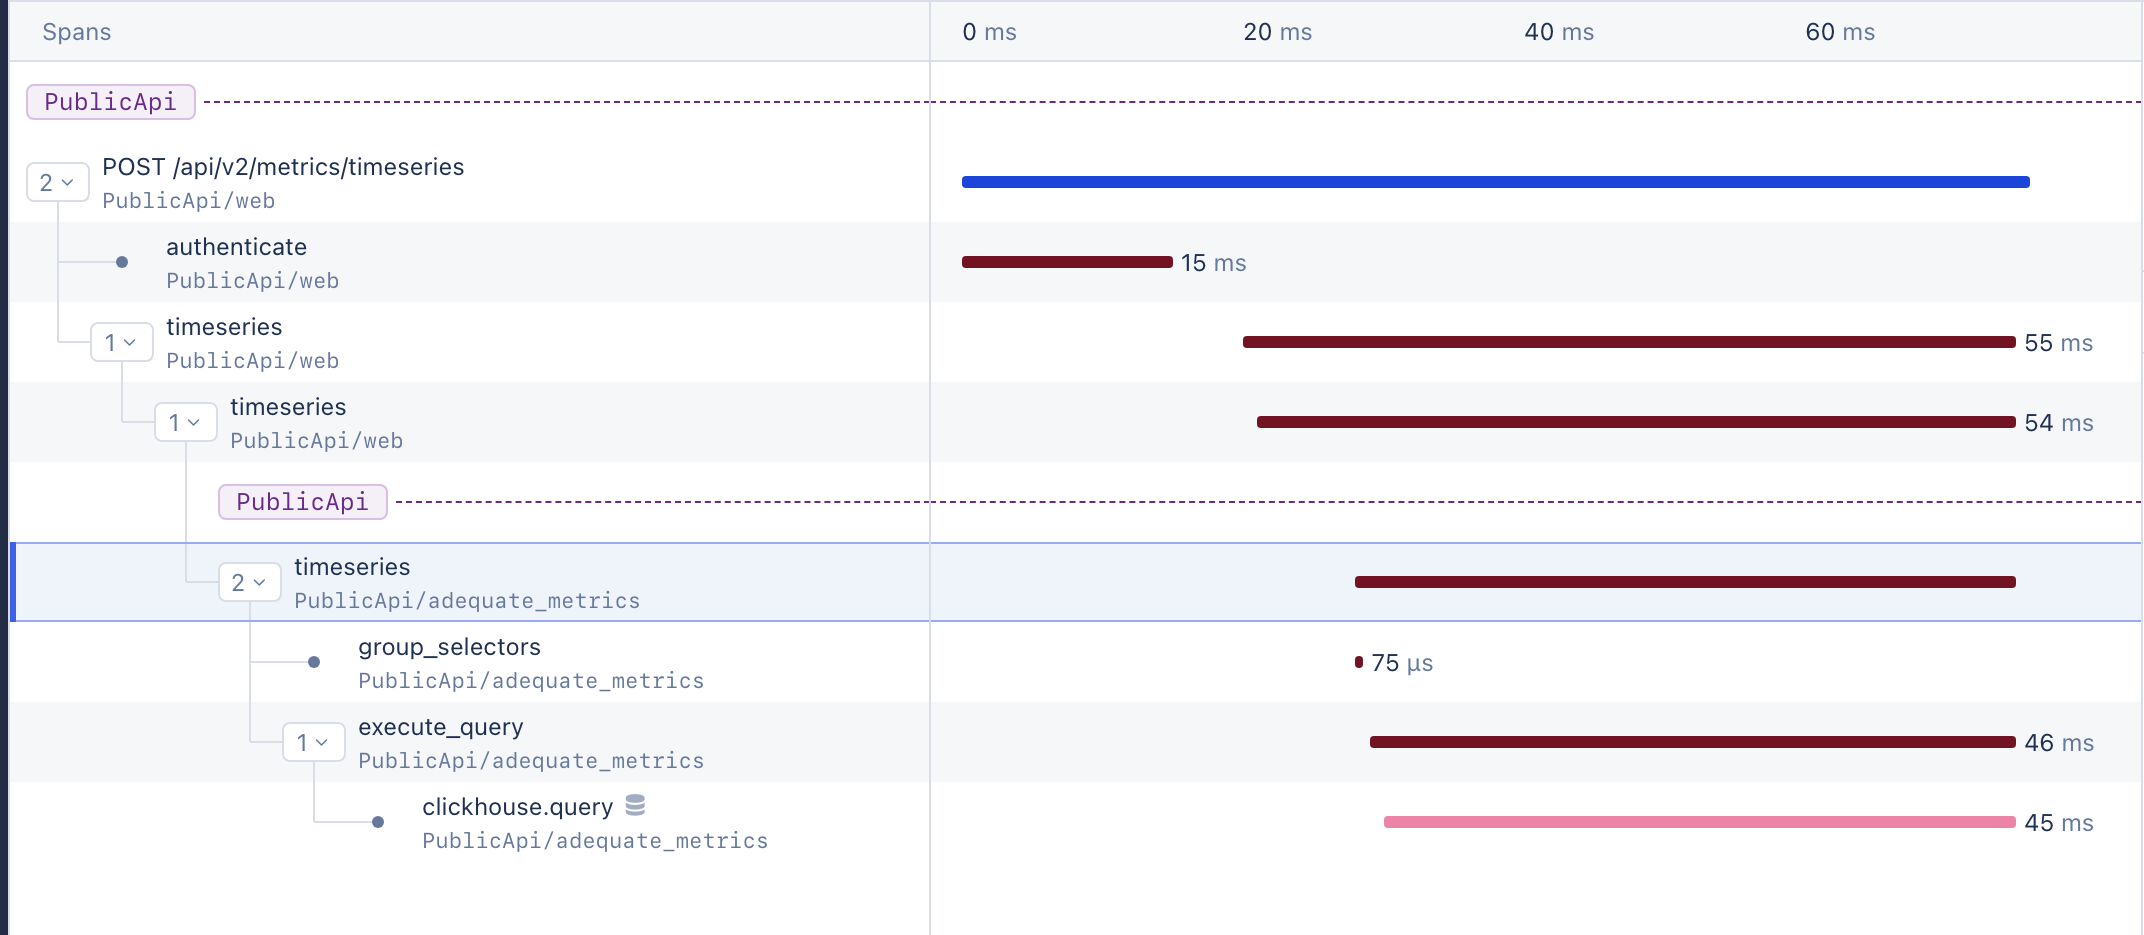
Span tree + timing: tree connectors, expand toggle (child count), leaf dot, service headers, group-colored bars, duration labels.
- Tree gutter: a vertical guide per depth. The last child gets an elbow (└); if more siblings follow, the vertical line continues.
- Expand toggle: spans with children show a child count + chevron (∨/›) button; leaves show a dot.
- Service name · namespace: name on one line (truncated), namespace in mono below it.
- Bar: left = (span start − timeline start) / total, width = duration / total (percentages). Subtrace roots omit the duration label (it is not their own work).